Discrete 2D Objects and Data Plots
Scatter plot
Scatter plots use points. In MuPAD we can use a few different shapes to represent points. In JavaView only one shape. This limits us a bit.
 MuPAD
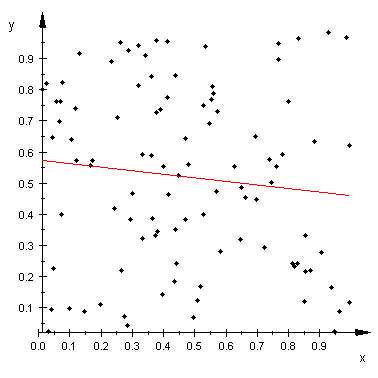
MuPAD
Image obtained in MuPAD.
JavaView
The same model in JavaView. Note - in MuPAD points may have a few different shapes (circle, square, diamond, etc. - all filled or empty inside). In JavaView we have only one type of points - filled circle. Perhaps a good way to distinguish them, in the same graph, would be to use different colors.
©2005 Miroslaw Majewski (created in Sep. 2004, last update 4/10/2005)