Discrete 2D Objects and Data Plots
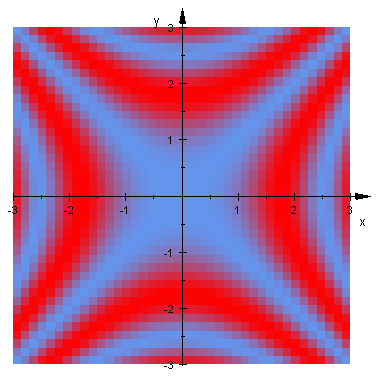
Density plot
Density plot is represented by a matrix of rectangles. This is very easy object to represent it in JavaView. The major objective is to check the accuracy how various shades of colors are transformed.
 MuPAD
MuPAD
Image obtained in MuPAD.
JavaView
The same model in JavaView.
©2005 Miroslaw Majewski (created in Sep. 2004, last update 4/10/2005)