Discrete 3D objects and presentation graphics
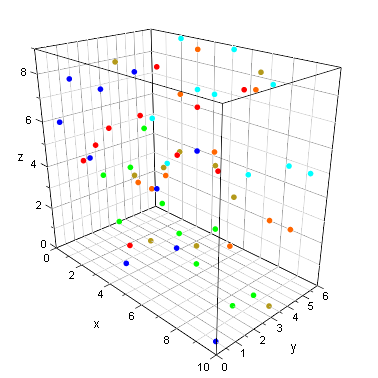
Bars3d, using BarStyle=Points
In this example we show the Bars3D plot with BarStyle=Points. We use also grids and subgrids. This makes the plot more readable.
MuPAD
Image obtained in MuPAD.
JavaView
The same model in JavaView. This model can be improved in many ways. For example turning on the Enable 3D-Look feature, and changing grids would make the image more readable.
© Miroslaw Majewski (created in Sep. 2004, last update 18/11/2005)